01
Strategy
Data-Driven Decision Making
I help teams stop guessing. Together we build a simple habit of letting the numbers — not the loudest voice in the room — guide the next move, so every decision has evidence behind it.
Strategy
Hi, I'm Shadrack Gachoka Ngigi — a data analyst and applied statistician based in Kenya. I help small businesses, startups and teams make sense of their numbers, forecast what's coming next, and tell the story behind the data in plain language.
Most businesses already sit on more data than they realise. The problem isn't collecting it — it's making it useful. That's the gap I close.
From cleaning messy spreadsheets to building forecasting models and clear dashboards, my work is guided by one simple rule: every number I show you should help you make a better decision tomorrow than you made today.
Whether you need a one-off analysis, an ongoing dashboard, or a full data-driven strategy — here's how I can help.
I help teams stop guessing. Together we build a simple habit of letting the numbers — not the loudest voice in the room — guide the next move, so every decision has evidence behind it.
Using your historical data, I build models that tell you what is likely to happen next — which customers may leave, when sales will dip, where demand is heading — so you can act early instead of reacting late.
Clear, interactive dashboards that turn scattered spreadsheets into one honest view of the business. Built for the people who actually use them — sales teams, managers, founders — not just analysts.
Practical use of modern AI and Large Language Models to speed up reporting, clean messy data, draft insights, and answer the everyday questions that used to eat entire afternoons.
A model means nothing if no one understands it. I translate technical findings into simple, persuasive stories your team, board, or clients can immediately act on.
I am a data and applied-statistics specialist who builds end-to-end analytical systems — from cleaning raw data and building predictive models to designing dashboards and communicating findings in language decision-makers actually use. My foundation is in statistical reasoning, machine learning, and time-series analysis; my day-to-day work is in R, Python, Power BI and Excel.
What separates a good model from a useful one is context. Because I have also worked on the commercial side — growing a customer base, exceeding sales targets, and leading project delivery — I do not just ask whether the model is accurate. I ask whether it answers the right business question, whether the insight can be acted on, and whether the story behind the number will persuade the people who need to act.
I approach every project as both a scientist and a strategist: rigorous methodology first, then the clearest possible translation into business impact. Whether the goal is forecasting demand, understanding customer behaviour, or automating reporting, I make sure the data leads to a decision — not just a presentation.
A live-style Power BI view of a sales dataset: revenue, product performance, and daily trends in a single glance.
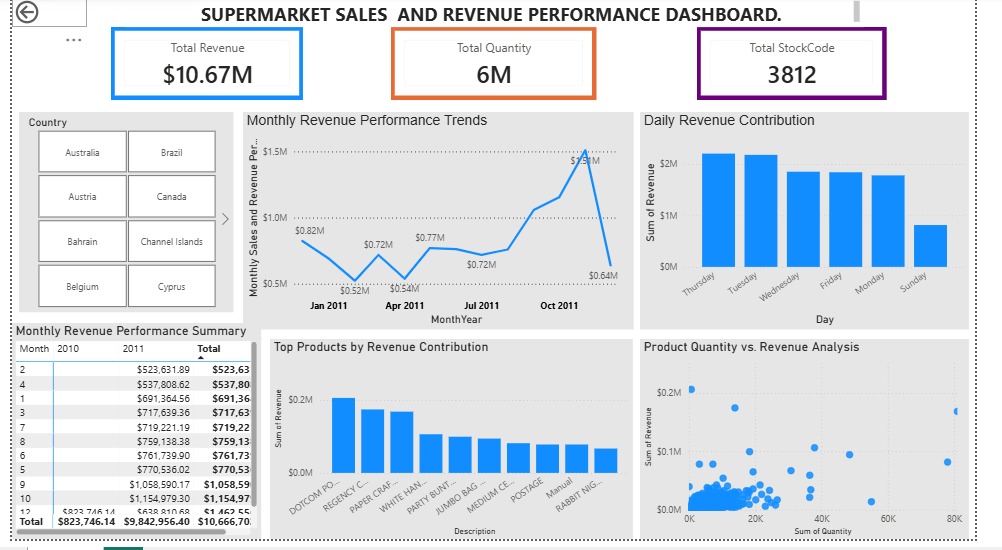
Built to give leadership an immediate read on revenue momentum, product contribution, and daily sales patterns — all filterable by country and time.
A live forecasting tool modelling milk production against temperature and rainfall — statistics turned into a decision aid anyone can open in a browser.
"Statistics taught the world how to separate signal from noise long before AI became a buzzword — and that foundation is not going anywhere."
The tools keep changing — today it's Large Language Models, tomorrow it will be something else. Chasing every new tool is exhausting and rarely pays off.
What lasts is understanding why a method works, not just how to run it. That's the mindset I bring to every project: solid reasoning first, the right tool second.
Learn the math and the reasoning first. The software is just the current costume statistics happens to be wearing.
Tell me a little about your business or project. I'll reply within a day with a clear next step — no jargon, no pressure.